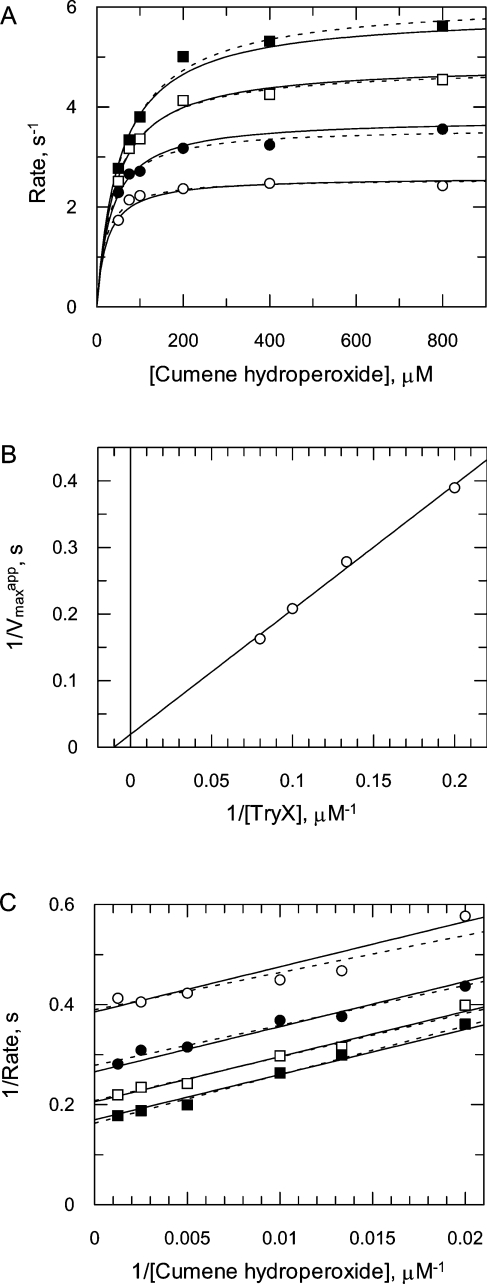
Figure 2. Kinetic analysis of TDPX2 with TryX and cumene hydroperoxide as substrate.
(A) The initial velocities were determined with varied cumene hydroperoxide concentrations and different TryX concentrations (■, 12.5 μM; □, 10 μM; ●, 7.5 μM; ○, 5 μM). The initial velocities for each individual data set were initially fitted individually to the Michaelis–Menten equation (broken line) by non-linear regression using GraFit and subsequently the entire data set was globally fitted to the equation describing a Ping Pong mechanism (continuous line). (B) The reciprocal Vappmax data, calculated for each TryX concentration data set, were plotted against the reciprocal TryX concentrations. The reciprocal intercept represents the reciprocal Vmax value and the reciprocal slope the rate constant k2 for TryX. (C) The reciprocal initial velocities are plotted against the reciprocal cumene hydroperoxide concentrations. This Figure shows the accuracy of the two fits transformed as a Lineweaver–Burk plot (continuous line, global fit; broken line, individual fits for each TryX concentration). The slope represents the reciprocal rate constant, k1, for cumene hydroperoxide. Kinetic constants are reported in Table 1.

