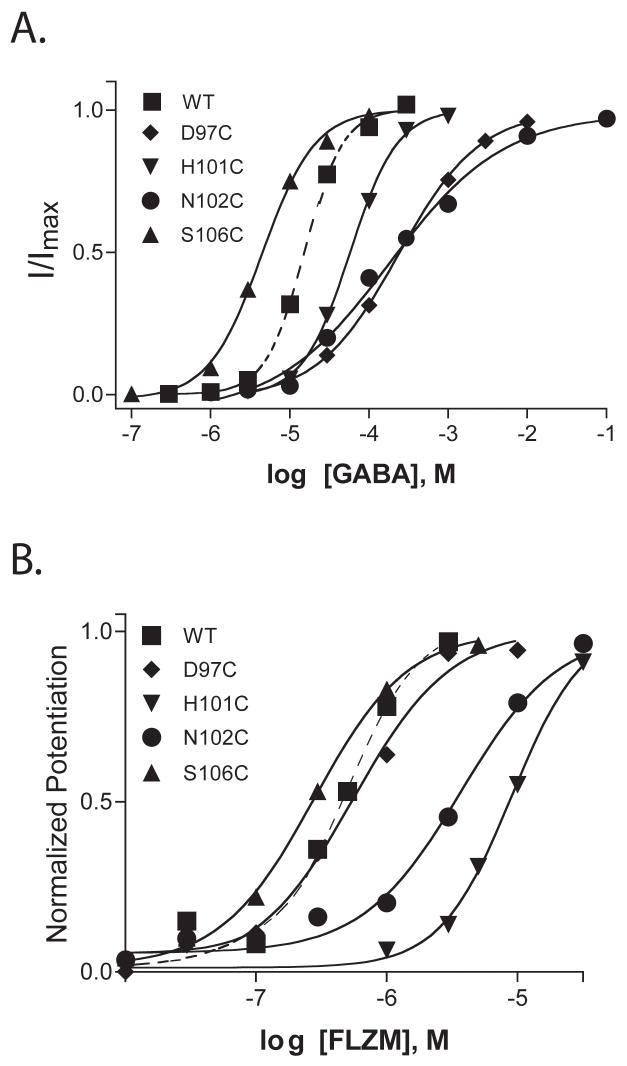
Figure 2. Representative GABA and FLZM concentration-response curves for wildtype and mutant receptors.
In panel A, the data are normalized to maximal GABA current response for each receptor. In panel B, the data are normalized to maximal FLZM potentiation of GABA (EC15) current. Dashed lines are curve fits from wild type receptors. EC50 values and calculated Hill coefficients are reported in Table 1.

