
Figure 3. Effects of MTSEA-Biotin on wildtype and mutant receptors.
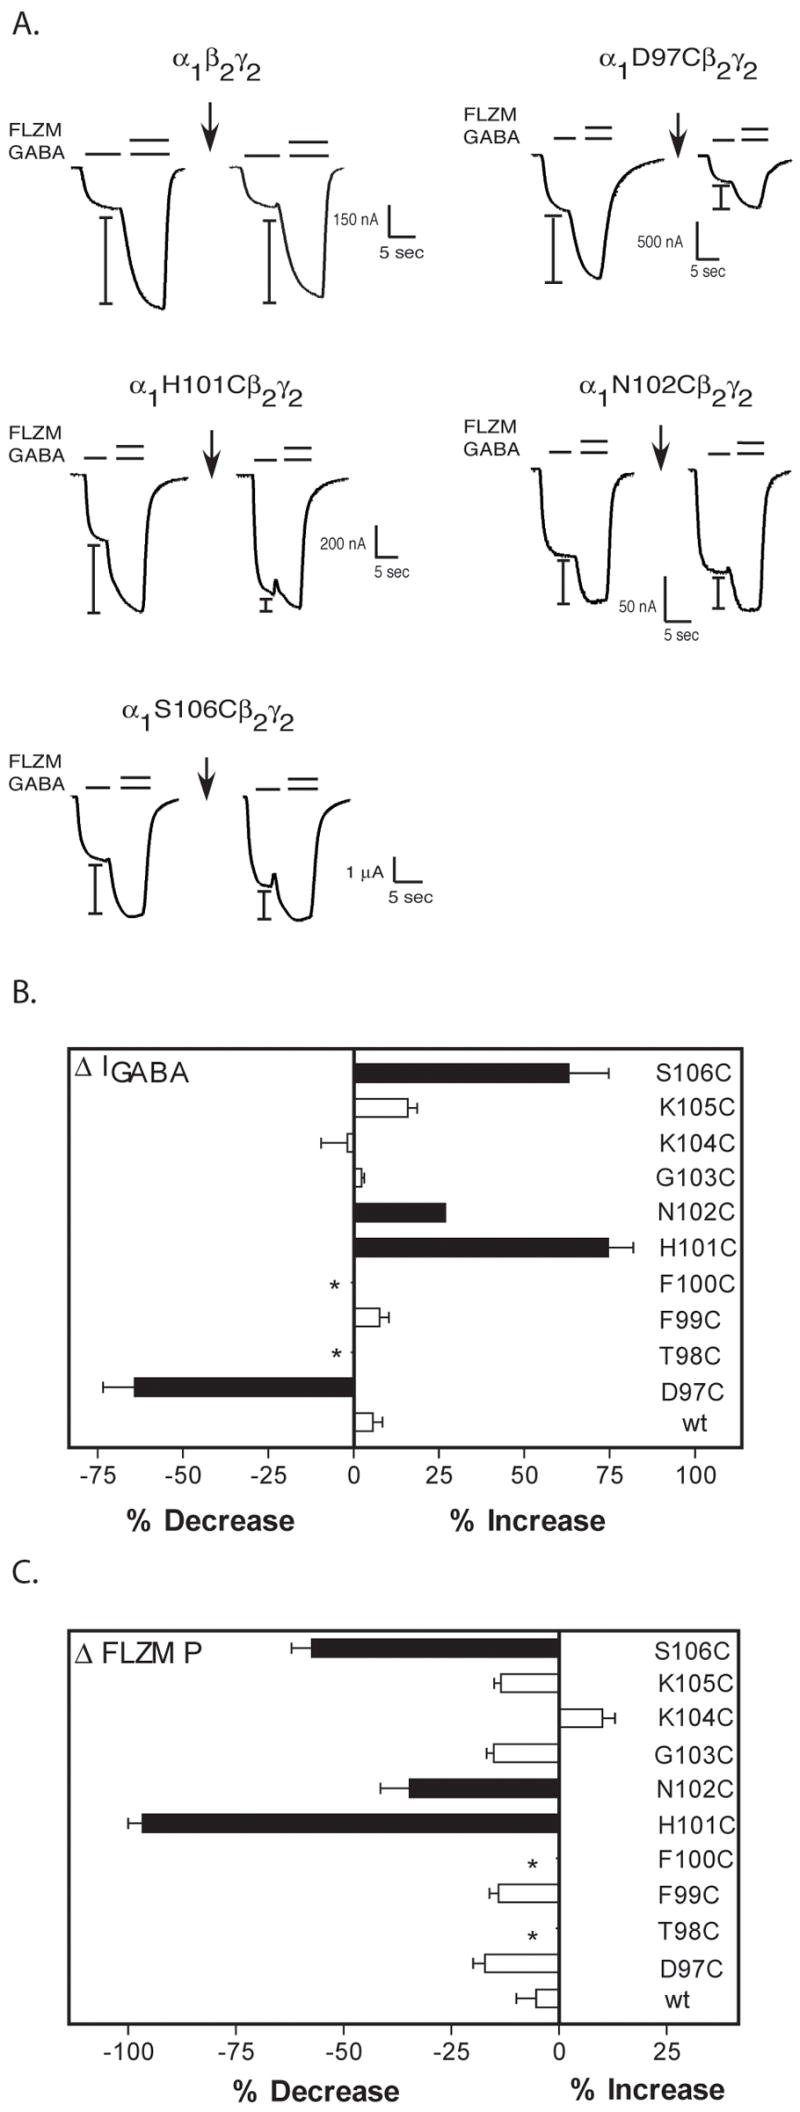
A. Representative current traces from oocytes expressing wild type and mutant α1β2γ2 receptors showing FLZM potentiation of I-GABA (EC15 GABA) before and after application of a 2 mM, 2 minute pulse of MTSEA-Biotin (arrows). I-bars denote potentiation of I-GABA measured during FLZM (EC95) application. B, C. Bar graphs representing the percent changes in I-GABA (ΔI-GABA) and FLZM potentiation (ΔP) following MTSEA-Biotin modification. The percent change in I-GABA is defined as [((I-GABA-after/I-GABA-before) − 1) × 100]. The percent change in FLZM potentiation (ΔP) is defined as [((ΔP-after/ΔPbefore) − 1) × 100]. Data represent the mean ± SD from 3 or more separate experiments. Black bars indicate values that are statistically different from wild type (wt) values (p < .05). *No detectable functional receptor expression.