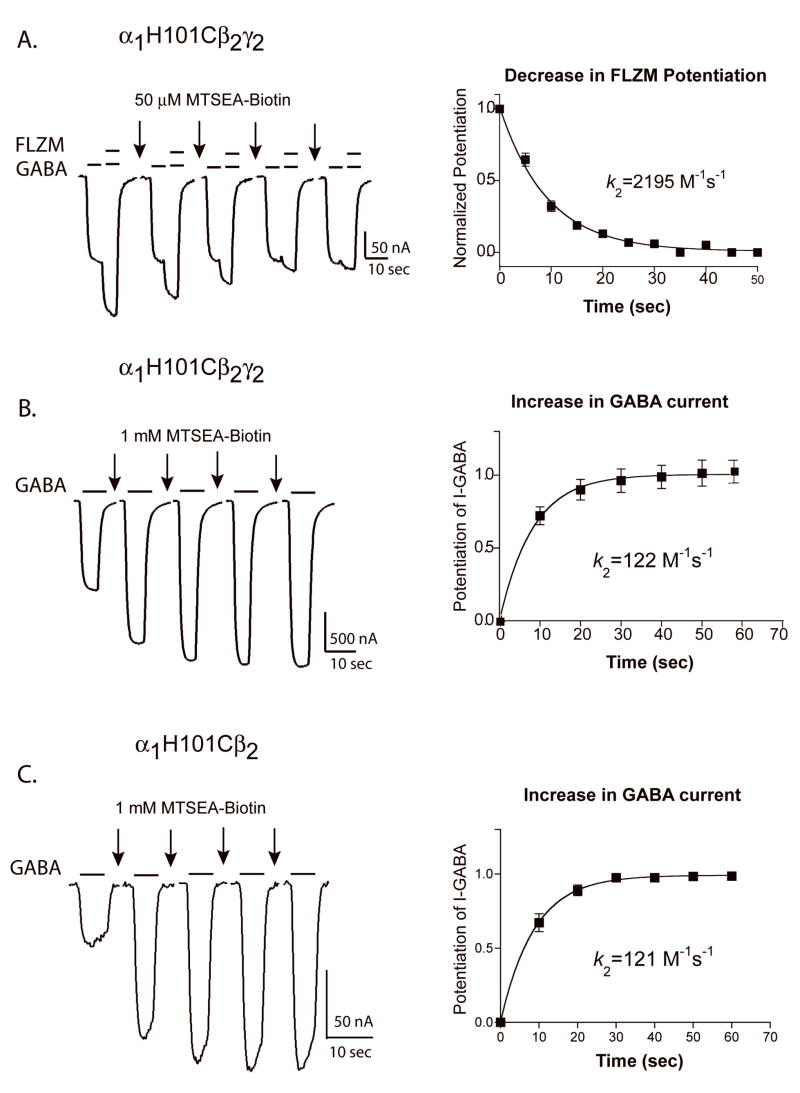
Figure 5. Rates of MTSEA-Biotin modification ofα1H101C.
Representative GABA (EC15) and GABA + FLZM (EC95) current responses from oocytes expressing α1H101Cβ2γ2 receptors (A and B) and α1H101Cβ2 receptors (C) before and after 10 sec applications of MTSEA-Biotin (arrows). Decreases in FLZM potentiation of I-GABA (A) and increases in I-GABA (B and C) were plotted versus cumulative MTSEA-Biotin exposure. In A, data were normalized to FLZM potentiation measured before MTSEA-Biotin exposure (t=0 sec). In B and C, data were normalized to I-GABA measured before MTSEA-Biotin exposure. The data were fit with single exponential functions and the calculated second order rate constants (k2) were determined as described in “Experimental Procedures”. Data points represent the mean +/− SEM from at least five independent experiments. k2 values are summarized in Table 2.

