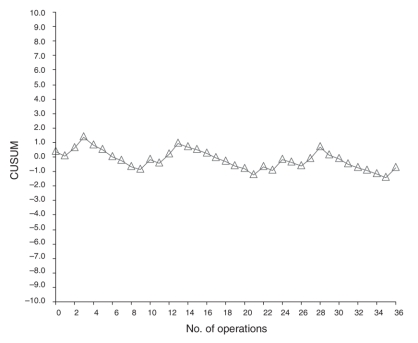
FIG. 1. CUSUM plot demonstrating flat curve sloping downward, suggesting morbidity is not exceeding predicted outcomes on a case-by-case basis. The shape of the curve does not demonstrate an obvious learning curve, suggesting reasonable proficiency from the beginning of practice. CUSUM = cumulative sum.

An official website of the United States government
Here's how you know
Official websites use .gov
A
.gov website belongs to an official
government organization in the United States.
Secure .gov websites use HTTPS
A lock (
) or https:// means you've safely
connected to the .gov website. Share sensitive
information only on official, secure websites.
