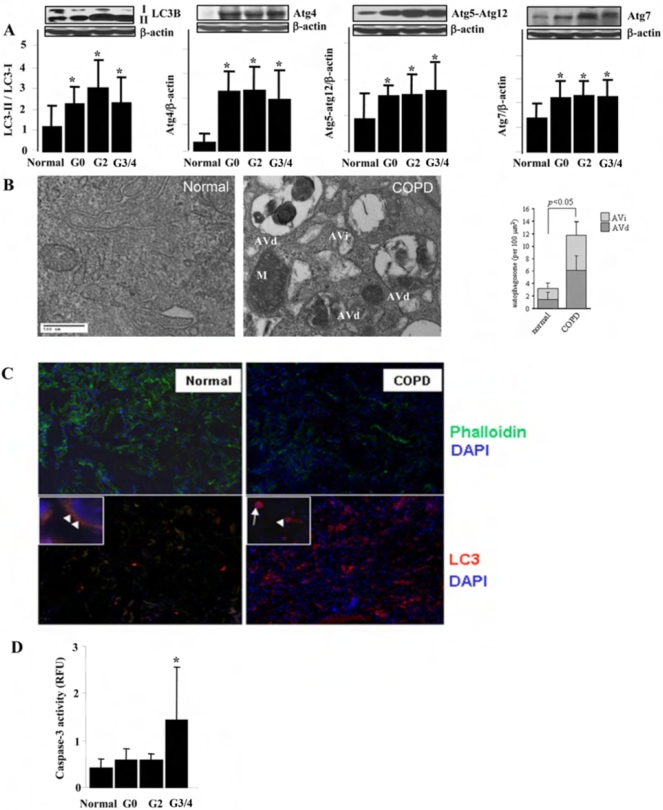
Figure 1. Autophagy and apoptosis in Lung Tissues from COPD Patients.
(A) Western blot analysis and corresponding quantification of autophagy related proteins, LC3-II/LC3-I, Atg4, Atg5-atg12 and Atg7, in human lung tissues from normal and COPD patients. Images are representative blots of the corresponding proteins. The sample numbers analyzed by densitometry for each group are: Normal (n = 12), G0 (n = 12), G2 (n = 12), G3/4 (n = 20). β-Actin served as the standard. (B) Representative EM study of human lung sections from a nonsmoker or COPD patient. M indicates mitochondria. AVi indicates immature autophagic vacuoles (autophagosomes). AVd indicates degradative, late autophagic vacuoles (autolysosomes). (Insert, Right) Peripheral lung epithelial cells were scored for number of immature autophagic vacuole (AVi) and degradative autophagic vacuoles (AVd). The data are represented as AVi and AVd per 100 µm2. Data are mean scores plus standard deviation. N = 30 images representative of COPD lung, and N = 15 images representative of control, at same magnification. *P<0.05 (C) Representative immunofluorescence staining of human lung sections from normal and COPD patient. Upper two images are tissues stained with Phalloidin (green), indicating the lung alveolar structure. Lower two images are tissues stained with LC3 (red). Images are at 200× and 600× (insets). White arrow indicates the immune cells and white arrowhead indicates epithelial cells. (D) Caspase-3 activity of lung tissues from normal and various stages of COPD patients (n = 10). (B, D) Data represent mean+/−S.D. *indicates P<0.05, ** indicates P<0.01.

