
Figure 2.
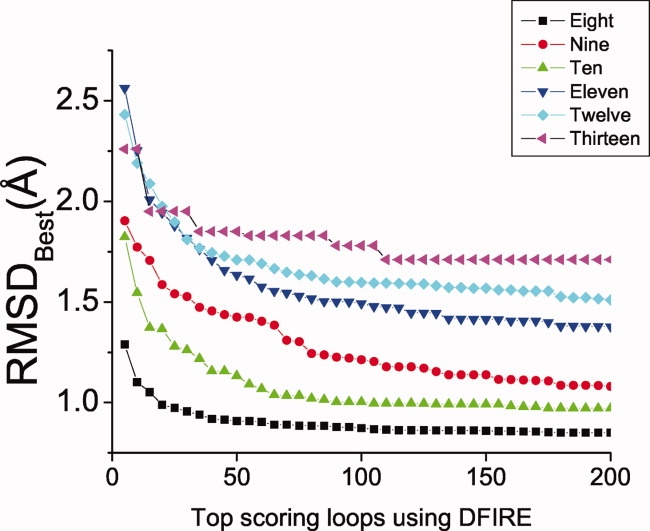
The lowest RMSD to native conformation as a function of the number of top scoring loops (RMSDBest) according to DFIRE. The curves represent averages taken over each loop length.
Official websites use .gov
A
.gov website belongs to an official
government organization in the United States.
Secure .gov websites use HTTPS
A lock (
) or https:// means you've safely
connected to the .gov website. Share sensitive
information only on official, secure websites.
The lowest RMSD to native conformation as a function of the number of top scoring loops (RMSDBest) according to DFIRE. The curves represent averages taken over each loop length.