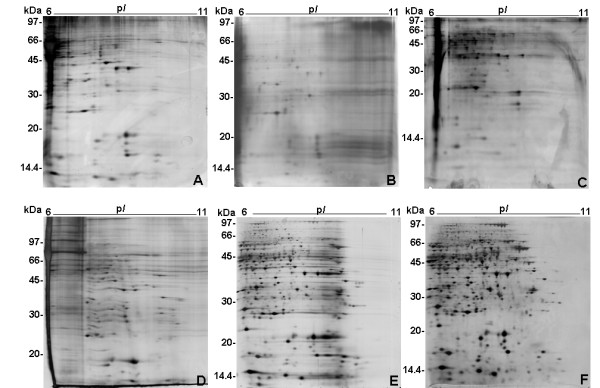
Figure 1.

Optimization of epimastigote alkaline 2-DE profiles. The 2-DE were performed using 6–11 pH IPG strip in IEF and 12% T SDS-PAGE in the second dimension and silver stained. One representative gel is shown for each IEF method used. A, B, C, D, E and F refer to the IEF method used according to Table 1. The sample amount was 500 μg protein/gel.
