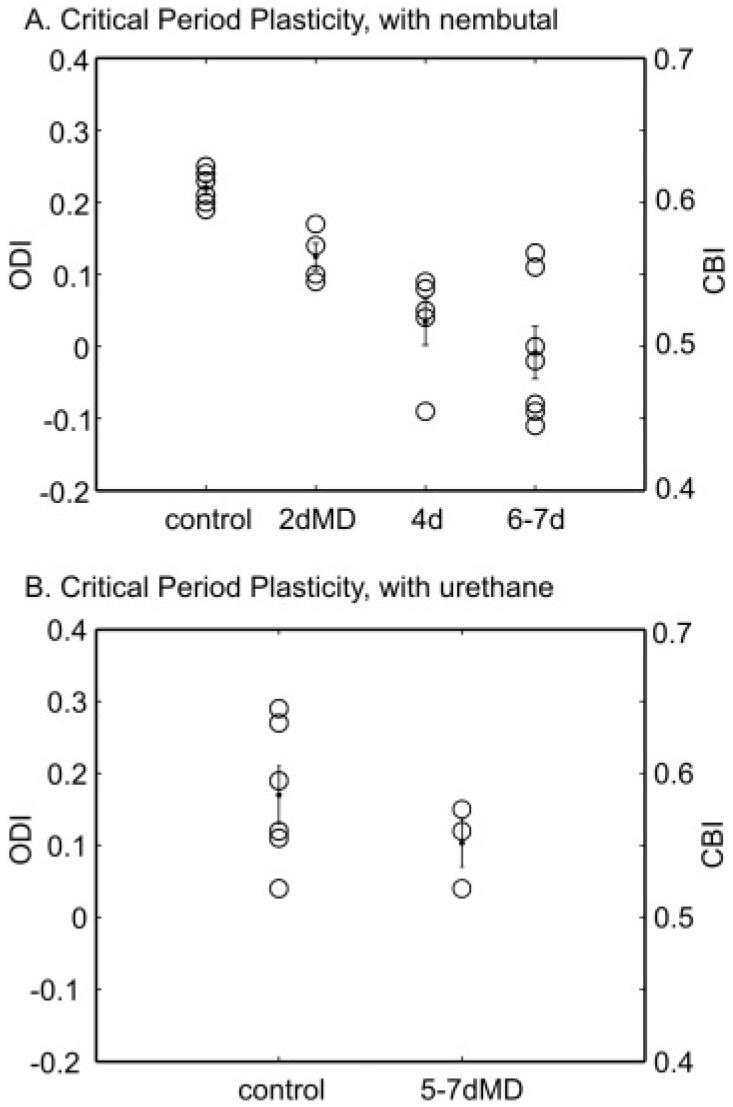
Fig. 4.
Effect of MD duration on OD shift revealed by imaging. (A) The ODI of each animal (open circle) is plotted against the duration of MD which started between P26 and P28. The mean and SEM of each group are also shown (dots).The ODI is related to the CBI used for analyzing single unit data by CBI = (ODI + 1)/2, so the corresponding CBI is also shown as the right axis for this and the following figures. Four-day MD induced a significant shift in ODI towards to the nondeprived eye (Control: 0.22 ± 0.01 vs. 4-day: 0.03 ± 0.03, P value < 0.05). The shift caused by 4-day MD is not significantly different from that by deprivation longer than 6 days (-0.01 ± 0.04, P > 0.05). In addition, 2-day MD did not induce a significant shift of the ODI (2-day: 0.12 ± 0.02, P > 0.05). (B) Same plot for results obtained from experiments using urethane as anesthesia. The ODI calculated from the imaging data is not significantly different between the control (0.17 ± 0.04, n = 6) and MD group (0.10 ± 0.03, n = 3; P value = 0.32).

