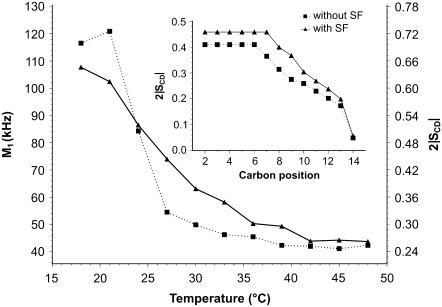
FIGURE 5.
Temperature dependence of M1 calculated for DMPC-2H27/DMPS (1:1 molar ratio) spectra at pH 4.5 without SF (squares) and with SF (Ri = 50, triangles). (Inner graph) SCD profile calculated for de-Paked spectra (see text) at T = 34°C. Labeled carbon positions were assigned according to the literature. Experimental error is in symbol size.

