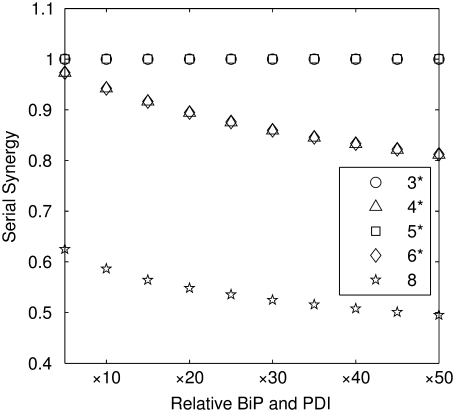
FIGURE 5.
Curves depicting the serial synergy values (serial synergy defined by Eq. 14) calculated for Models 3*−6* and 8 over a variety of BiP and PDI overexpression levels. In this plot, “Relative BiP and PDI” indicates the factor by which both BiP and PDI were overexpressed for that particular value. Values for further permutations in relative BiP and PDI overexpression were calculated, but they displayed similar relative behavior and are not included on this plot for simplicity.

