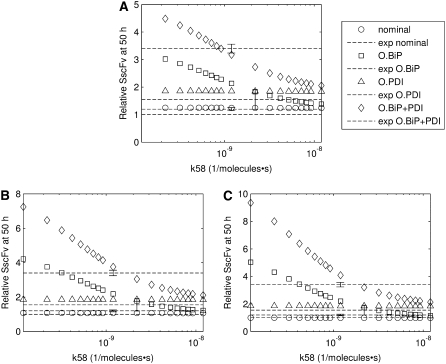
FIGURE 8.
Plots demonstrating SscFv production dependency on the rate at which cytoplasmic UscFv was trafficked to the translocon (k58) for double BiP and PDI (A), triple BiP and PDI (B), and quadruple BiP and PDI (C) overexpression levels. SscFv levels were measured at 50 h and compared to the experimental values (dashed lines). Error bars for the experimental data are provided on one experimental data point for ease of interpretation but apply to all: O.BiP+PDI and O.BiP error bars are found at  O.PDI, at
  and nominal, at

