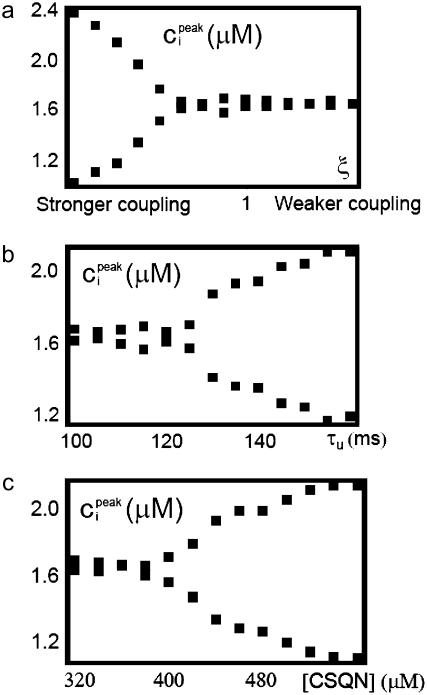
FIGURE 11.
(a) Maximum averaged cytosolic Ca2+ concentration ci on alternate beats during steady-state pacing as a function of the coupling strength scaling factor ξ. The parameter ξ scales all the nearest-neighbor diffusive timescales (i.e., τ → ξτ). Stronger coupling promotes CTA. (b) Maximum averaged cytosolic Ca2+ concentration ci on alternate beats during steady-state pacing as a function of the unbinding time τu. Larger unbinding time promotes CTA. (c) Maximum averaged cytosolic Ca2+ concentration ci on alternate beats during steady-state pacing as a function of the concentration of CSQN sites. A larger concentration of CSQN sites promotes CTA. When not varied, the parameter values are τu = 125 ms, [CSQN] = 400 μM, and ξ = 0.4.

