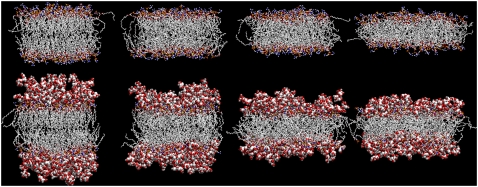
FIGURE 4.
Final configurations (20 ns for A; 30 ns for B–D) of the simulations of a hydrated DPPC bilayer at 325 K and lateral pressures of (left to right) (A) 1 bar; (B) −100 bar; (C) −150 bar; and (D) −200 bar, either in pure water (top; Aw, Bw, Cw, and Dw) or in a 2-m TRH solution (bottom; At, Bt, Ct, and Dt). The DPPC molecules are represented using a licorice model, and TRH molecules using a space fill model. For DPPC and TRH, carbon atoms are represented in silver, oxygen atoms in red, phosphorus atoms in yellow, nitrogen atoms in blue, and hydrogen atoms in gray. See Table 1 for the simulation codes.

