FIGURE 2.
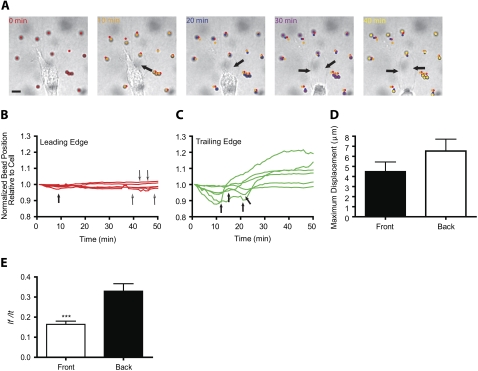
Deformation of the matrix at the leading and trailing edges of a migrating cell. (A) Initial deformation of the collagen matrix toward the back of a migrating HT-1080 cell followed by the relaxation of the matrix away from the cell. Arrows indicate the formation of a growing defect in the collagen matrix in the wake of the migrating cell. Scale bar, 20 μm. See also Movie S1, Data S1. (B and C) Changes in the distances between beads and fixed points in the image in the matrix regions near the leading edge (B) and near the back (C) of a migrating HT-1080 cell (shown in panel A). Distances were normalized by their initial value. Beads and curves in panels B and C are color-coded according to their position in panel A. Thick arrows indicate onsets of relaxation; narrow arrows in panel B indicate beads that have not relaxed yet. (D) Averaged maximum displacements of the beads toward the cell, lmax, in regions of the matrix at the back and front of control HT-1080 cells. (E) Averaged ratios of the net distance between the initial and final positions of the beads, lf, and their total displacements, lt, in regions of the matrix near the front and back of the cell. A ratio close to zero indicates an elastic, reversible deformation of the matrix; a ratio close to one indicates an irreversible “rupture” deformation of the matrix. ***p < 0.001. In panels D and E, at least 10 cells were probed and a total of at least 100 beads were tracked.

