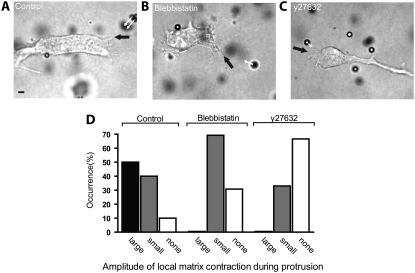
FIGURE 5.
Correlation between protrusive activity and matrix deformation during 3D cell migration. (A–C) Examples of actively growing membrane protrusions (black arrow) and associated local matrix deformations (white arrows) for a control HT-1080 cell (A), a 5 μM blebbistatin-treated cell (B), and a Y27632-treated cell (C). Scale bar, 20 μm. (D) Occurrence and magnitude of local collagen matrix deformations in the vicinity of actively growing cell membrane protrusions (see text for details). This shows that matrix deformations toward a control occurred only in the presence of growing cell protrusions. This correlation largely disappeared after inhibition of ROCK or partial inhibition of myosin II. Ten individual cells were probed and a total of at least 100 beads were tracked in three dimensions per condition.

