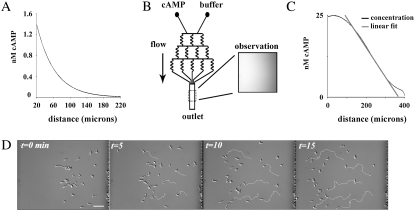
FIGURE 1.
Experimental and analytical paradigm to measure directed and persistent random motility. (A) Quantitation of fluorescein (MW 332.3) diffusing from a micropipette reveals the nonlinear concentration profile in the assay. (B) Schematic of the microfluidic device used in the study; manipulation of the flow into the two inlets (labeled cAMP and buffer) enables the production of stable concentration gradients. Inset, image of fluorescein fluorescence in the device. (C) Quantification from a line scan of fluorescein image in B detailing experimental control over chemoattractant profiles. Flowing buffer and cAMP at identical flow rates creates linear chemoattractant concentration gradients for chemotaxis that are stable over experimental timescales (<90 min). (D) Time series showing the chemotaxis of wt cells in the microfluidic device when exposed to a linear cAMP gradient of 50 pM/μm cAMP with a midpoint of 12.5 nM (concentration increases from right to left and flow is from top to bottom). For clarity, five cells were chosen and their respective tracks are shown in white.

