FIGURE 3.
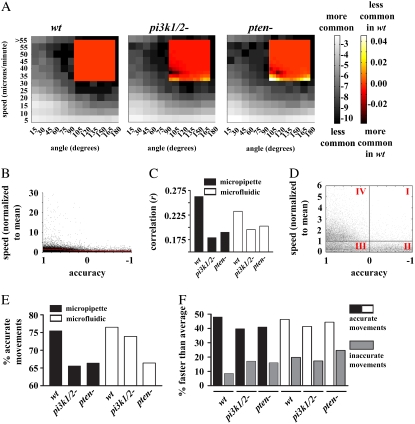
During chemotaxis, accurate movements tend to be faster movements. (A) Two-dimensional histograms displaying the log of the probability that a cell will make a movement during chemotaxis in the micropipette and microfluidic assay with a particular angle (x axis) and speed (y axis) represented in grayscale. Speed values are separated in bins 5 μm/min wide; angles are in bins 15° wide and each bin is labeled with the upper limit for that bin. The heat-mapped insets show the difference between a given mutant and wt. Doubling and halving the bin widths had no appreciable effect on the general conclusion. Similar patterns can be seen in 2-D histograms of movements from the microfluidic device. (B) Scatter plot of the accuracy of wt movements versus their speed after normalized to each individual cell's mean speed. A linear fit (red line) indicates the correlation between accuracy and speed. (C) Correlation coefficients between each genotype's accuracy and normalized speed (as in B). Each correlation was found to be significant at p < 0.05 level. (D) A magnification of the plot from B. This plot, containing >99% of the total data, can be divided into four regions (labeled I, II, III, and IV) that describe the accuracy and speed of the cell (see text). (E) Percent of movements from each genotype with positive accuracy (quadrants III and IV in D). (F) Percent of accurate and inaccurate movements with faster than average speeds.

