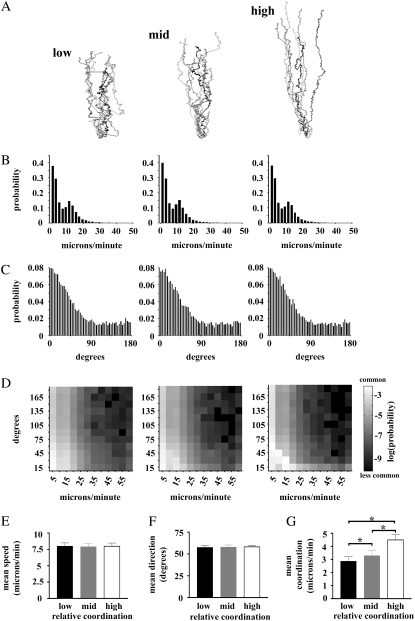
FIGURE 4.
Simulations of coordination reveal its effect on chemotactic efficiency. (A) “Tracks” of cells from a stochastic simulation of chemotaxis with varying degrees of coordination between directional accuracy and speed. (B and C) The probability distribution of the speed and direction, respectively, of cells in A. (D) The two-dimensional probability distributions reveal the dependency of directional accuracy and speed in the simulations in A. (E and F) Mean speed and direction for each simulation in A. (G) Mean coordination index for each simulation. The stars indicate differences at the p < 0.05 level by Bonferroni t-test after ANOVA.

