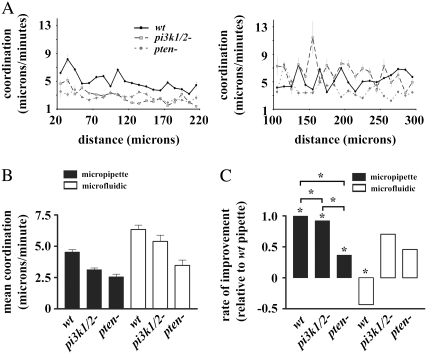
FIGURE 5.
Coordination in linear and nonlinear concentration gradients. (A) Coordination versus distance from the highest chemoattractant concentration present in the nonlinear gradient (left) and linear gradient (right). (B) Comparison of the mean coordination of the three genotypes in the linear and nonlinear gradients. (C) Statistical comparison of the rate of improvement of coordination in the micropipette assay and the linear region of the microfluidic device. For comparison of the increase in the coordination, the rate of increase was normalized to the rate of wt cells in the micropipette assay. Stars represent statistically significant differences at p < 0.05.

