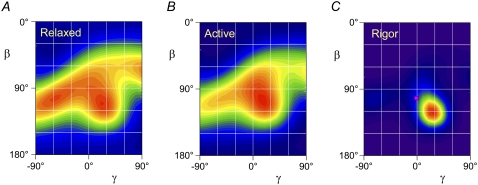
FIGURE 4.
Contour plots of the ME orientation distributions (β, γ) of the LCD in relaxation (A), active contraction (B), and rigor (C), calculated from the 〈P2〉 and 〈P4〉 data in Fig. 3 using the crystal structure of nucleotide-free chicken skeletal myosin (1). Hotter colors indicate a higher probability of that orientation. The pink square in C denotes the orientation of actin-attached chicken skeletal myosin in the absence of ATP (2).

