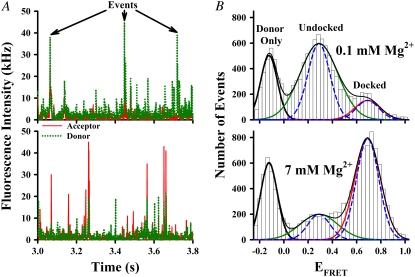
FIGURE 2.
Sample smFRET data analysis of freely diffusing tetraloop-receptor RNA. (A) Sample time traces of donor (dotted green lines) and acceptor (solid red lines) intensities at 0.1 mM Mg2+ (top) and 7 mM Mg2+ (bottom) indicate photon burst events as a molecule traverses the laser focal volume. (B) EFRET histograms generated from events that exceed a 25 kHz threshold at 0.1 mM Mg2+ (top) and 7 mM Mg2+ (bottom) fit to a sum of three Gaussian distributions (black line). The individual Gaussian components reveal distinct populations of donor-only (EFRET < 0, thick black), undocked (green) and docked (red) constructs. Dashed blue lines represent shot-noise limited line-shape predictions.

