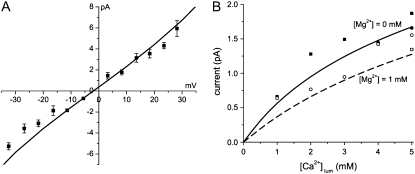
FIGURE 2.
Comparison of the permeation (PNP/DFT) model predictions (lines) to experimental data (symbols) collected under physiological ionic conditions. (A) Current/voltage curve under our approximate physiological concentrations at ∼Vrev. Currents are from single RyR2 channels reconstituted in planar lipid bilayers. These data were collected using the methods described by Kettlun et al. (55). The mean ± SE are shown and n = 4–8. Between ±15 mV, a linear least-squares fit (not shown) indicated a gRyR = 197 pS and Vrev = −2.3 mV, which is almost identical to the permeation model curve (gRyR = 192 pS and Vrev = −1.9 mV). (B) Comparing the model to data published in Kettlun et al. (55). (Solid line/solid symbols) The current at 0 mV applied voltage with symmetric [K+] = 150 mM as luminal Ca2+ is added. (Dashed line/open symbols) The current at 0 mV applied voltage with symmetric [K+] = 150 mM and [Mg2+] = 1 mM as luminal Ca2+ is added. Squares are from mammalian cardiac muscle RyR and circles are from amphibian skeletal muscle RyR.

