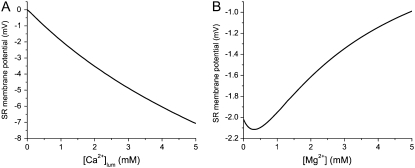
FIGURE 4.
Changes in stationary SR membrane potential as divalent concentrations vary, as computed by the PNP/DFT model. (A) [Ca2+]lum is increased with symmetric [K+] = 150 mM and [Mg2+] = 1 mM. (B) [Mg2+] is increased symmetrically as [K+] = 150 mM and [Ca2+]lum = 1 mM. The minimum in the potential is probably due to an anomalous mole fraction effect similar to the one previously discovered by the model from Gillespie (46).

