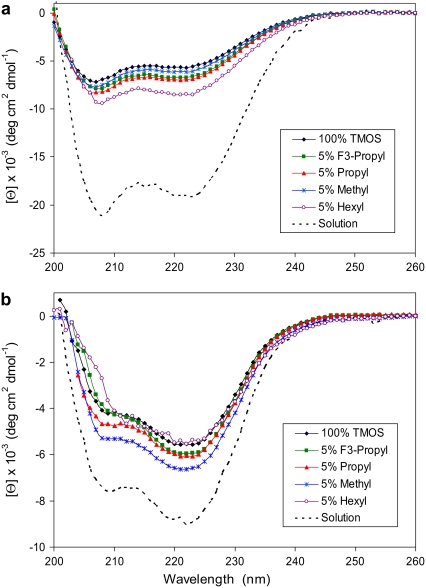
FIGURE 1.
Molar ellipticity of apomyoglobin (a) and cytochrome c (b) after adsorption onto glasses of variable composition. Each glass wafer was analyzed by CD at 25°C in the presence of 10 mM phosphate, pH 7.0. The solution spectra were measured at t = 0 before incubation with the glass samples. (See detailed description of materials and methods in Data S1.)

