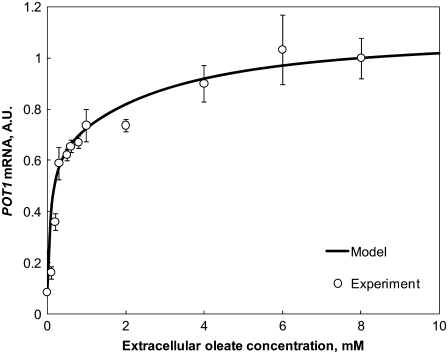
FIGURE 2.
The model recapitulates the measured relative dose response for POT1 expression. Data points indicate the activity of a luciferase reporter gene with the POT1 promoter in yeast cells grown overnight in media with oleate at the indicated initial concentration (13). The predicted POT1 expression levels from the model (line plot) have been normalized relative to the luciferase activity in 8 mM oleate.

