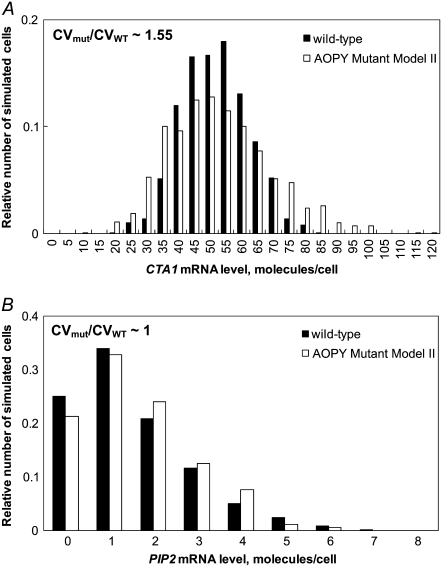
FIGURE 4.
An in silico model of a mutant strain in which both PIP2 and CTA1 are solely ORE-activated (AOPY Mutant Model II, corresponding to an adr1Δ strain with the ability to fully induce ORE-driven expression) is predicted to have greater variability of CTA1, but not PIP2 expression, than the WT model. The histograms show the simulated population heterogeneity of (A) CTA1 and (B) PIP2 mRNA levels in WT (black bars) and a mutant adr1Δ strain in which PIP2 and CTA1 have increased ORE-driven transcriptional activity (white bars) in oleate growth conditions. The abscissas represent the distribution of the (A) CTA1 and (B) PIP2 mRNA concentrations after 100 min of stochastic simulation with initial conditions given by the steady-state solution to the ODE kinetic model with constant 0.12% oleate. Stochastic simulations were carried out for an ensemble of 1000 realizations of the stochastic process. CVmut represents the steady-state CV of expression levels of the indicated reporter in AOPY Mutant Model II, and CVWT represents the CV of the indicated reporter in the WT model.

