FIGURE 5.
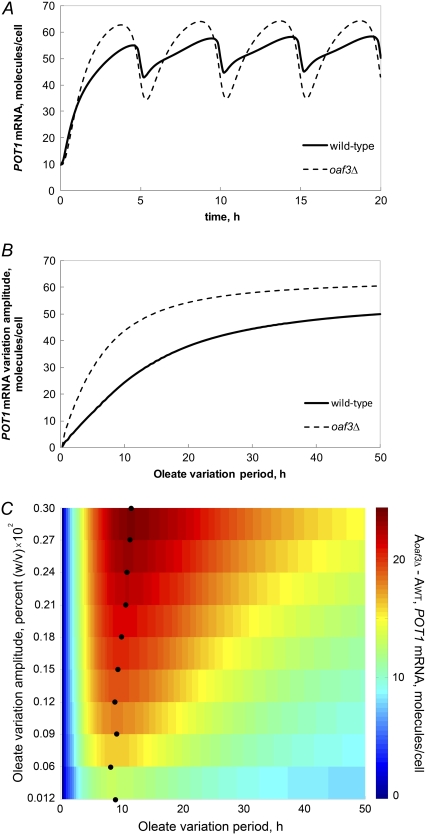
Deletion of Oaf3p in the model makes POT1 transcriptional activity undergo larger-amplitude oscillations in response to a temporally varying concentration of intracellular FA. WT and oaf3Δ models of POT1 transcription were solved for the case of a temporally oscillating concentration of oleate. (A) POT1 undergoes higher-amplitude oscillations in the oaf3Δ model than in the WT model. (B) The difference between POT1 mRNA variation amplitudes in the oaf3Δ model and WT increases with increasing period of oleate pulsing. When the period exceeds 10 h, the difference between the oaf3Δ model and WT model amplitudes starts to decrease. (C) The difference between the POT1 mRNA variation amplitudes in the oaf3Δ (Aoaf3Δ) and WT (AWT) models, for different values of the period and amplitude of oleate concentration oscillation. Color indicates the POT1 amplitude difference between the oaf3Δ model and the WT model. Overall, the difference between the amplitude of POT1 variation in the two models is stronger at higher values of the oleate oscillation amplitude. Furthermore, as the oleate oscillation amplitude increases, the maximum POT1 amplitude difference (dark red) is observed at slightly increasing values of the oleate oscillation period (black circles).

