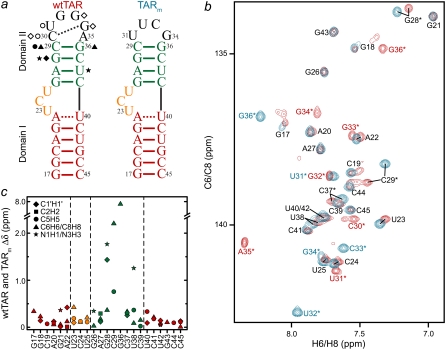
FIGURE 1.
NMR chemical shift comparison of wtTAR and TARm. (a) Secondary structures of wtTAR and TARm. Residues with the largest chemical shift perturbations (>0.25 ppm) between wtTAR and TARm are highlighted on the wtTAR secondary structure using solid black symbols. Apical loop residues that undergo significant chemical shift perturbations upon ARG binding are highlighted in open black symbols. See inset in c for symbol key. (b) 2D 1H-13C HSQC spectra of wtTAR (red) overlaid on corresponding spectra of TARm (blue). Asterisks and colored labels denote resonances that are different between wtTAR and TARm due to the loop mutation. (c) Chemical shift differences ( where
where  and
and  are the changes in proton and carbon/nitrogen chemical shift and α is the ratio of the H and C/N gyromagnetic ratio) between wtTAR and TARm.

