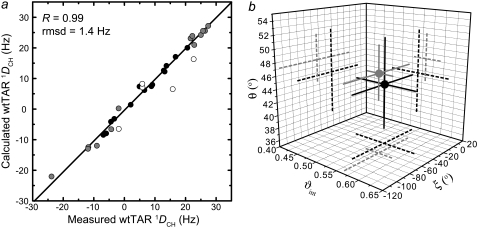
FIGURE 2.
RDC-based comparison of the wtTAR and TARm conformational dynamics. (a) Correlation plot between measured and back-calculated wtTAR RDCs when each stem order tensor is independently fit to an idealized A-form geometry. Domain II is shown in gray, and domain I is shown in black, with A22 and U40 represented by open black circles. (b) The values for the interhelical bend (θ), twist angle (ξ), and the interhelical mobility (ϑint) determined for wtTAR (black) and TARm (gray). Experimental errors are shown.

