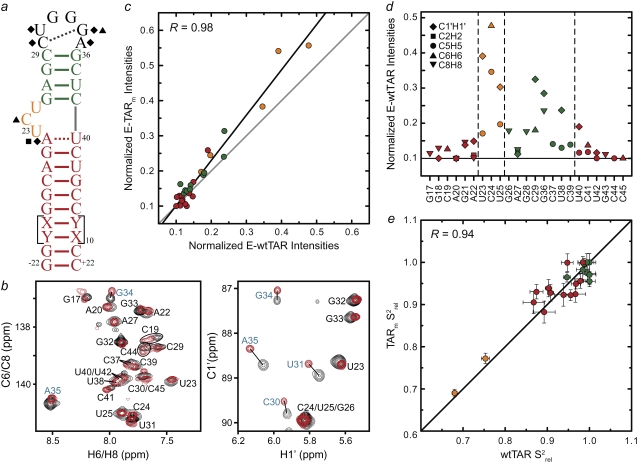
FIGURE 3.
Spin relaxation-based comparison of the E-wtTAR and E-TARm conformational dynamics. (a) Elongated construct of wtTAR in which XY are unlabeled CG (E-GC-wtTAR) and UA (and E-AU-wtTAR) residues as previously described (29). Residues that undergo significant chemical shift perturbations upon elongation are highlighted on the secondary structure using black solid symbols. See inset in Fig. 1 d for symbol key. (b) 2D HSQC spectra of wtTAR (red) overlaid on corresponding spectra of E-AU-wtTAR and E-GC-wtTAR (black). Blue labels denote loop resonances that shift upon elongation. (c) Correlation plot between the E-wtTAR and E-TARm normalized intensities. Shown is the correlation coefficient (R). (d) Normalized resonance intensities (peak heights) measured from 2D HSQC spectra of E-wtTAR. See inset for key. (e) Correlation plot between nucleobase carbon  values measured in nonelongated wtTAR and TARm. Values for domain I, bulge, and domain II are shown in red, orange, and green circles, respectively.

