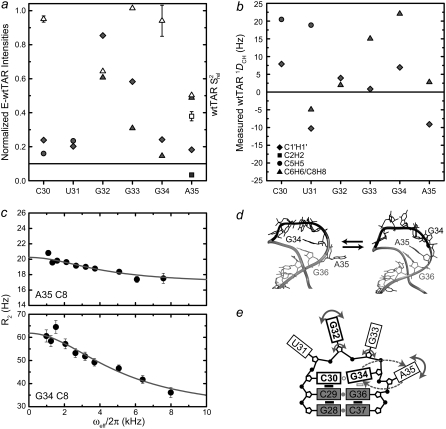
FIGURE 4.
Dynamics of the wtTAR loop. Shown are the (a) normalized intensities for E-wtTAR (solid symbols) and  values for nonelongated wtTAR (open symbols) and (b) one-bond C-H RDCs measured in the wtTAR loop (see inset for key). (c) Carbon R2 as a function of field strength (ωeff) for residues G34 (C8) and A35 (C8). Note that R2 = R2,int + Rex = R1ρ/sin2θ − R1tan2θ. (d) Two snapshots from the 65 ns MD simulation of wtTAR illustrating the looping in and out of A35. (e) Schematic diagram of the observed wtTAR apical loop dynamics. Nucleobases, ribose moieties, and phosphate groups are represented by large rectangles, black pentagons, and solid black circles, respectively. Smaller black rectangles denote base-base stacking. Gray circles indicate hydrogen bonding between bases. The open gray rectangle indicates transient base-base stacking. The open gray circle indicates a transient hydrogen bond across the loop. Fast motions are indicated by solid arrows. The looping in and out of A35 and G34 is indicated by dashed arrows. Functionally important loop nucleotides are indicated by bolded labels and rectangles.

