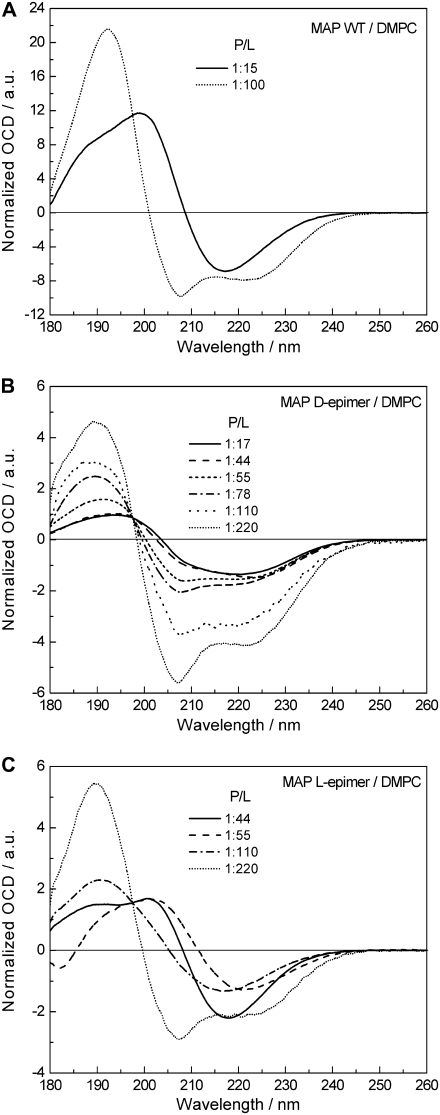
FIGURE 3.
OCD comparison of the cell-penetrating MAP wild-type peptide and its CF3-Phg substituted d- and l-epimeric analogs in DMPC bilayers as a function of P/L ratio. All spectra were acquired at 40°C and 98% rH, and normalized to cross the same isodichroic point at 197.5 nm. (A) MAP wild-type: showing at a low P/L ratio of 1:100 the peptide in an α-helical conformation and S-state, whereas at high P/L of 1:15 a β-stranded structure is predominant. (B) MAP d-epimer: showing an α-helical conformation throughout, and realignment from S- to T-state with increasing peptide concentration. (C) MAP l-epimer: showing the peptide in an α-helical conformation and S-state at low concentration, and β-pleated structure at high P/L ratios.

