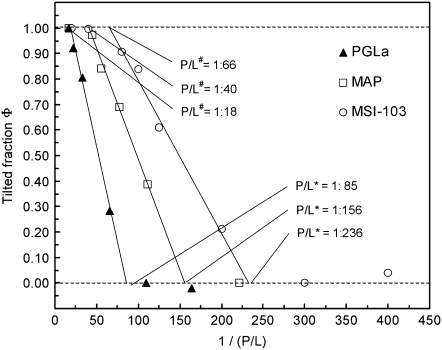
FIGURE 4.
Fraction φ of the tilted peptide in the T-state as a function of the inverse (P/L) ratio for PGLa, MSI-103, and the MAP D-epimer in DMPC bilayers. Data in the transition regions were fitted to straight lines, whose points of intersection with the φ = 0 line give the threshold P/L* values, where the T-state starts to appear. Above some higher threshold value P/L#, which is obtained from the intersection of the fitted lines with the Φ = 1 line, all peptides have finally reached the T-state.

