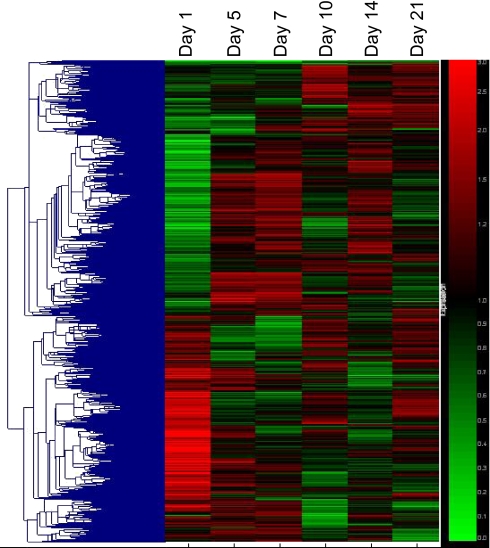
Fig. 2.
Cluster analysis of gene expression profiles in mouse fracture callous. Five thousand five hundred forty-six genes that are “present” in at least one out of the six samples and have a greater than twofold change between one of the time points was used in this analysis. Genes differentially expressed following fracture cluster into distinct expression patterns

