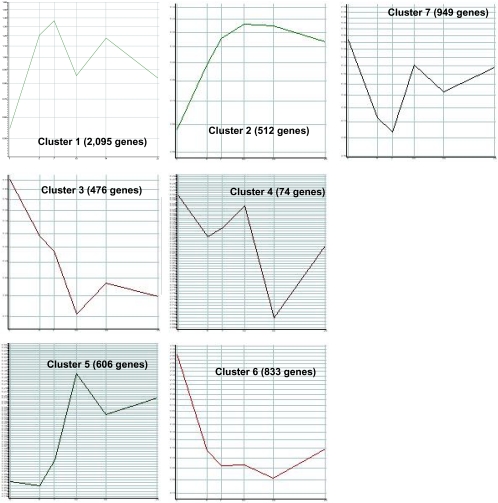
Fig. 3.
Five thousand five hundred forty-six genes that are “present” in at least one out of the six samples and have a greater than twofold change between one of the time points was used in this analysis. Genes differentially expressed following fracture cluster into distinct expression patterns. Relative expression levels are shown on the y-axis with the corresponding time points on the x-axis in days. Each cluster represents the average gene expression pattern for genes within the cluster. The number of cluster members is indicated in parentheses next to the cluster number

