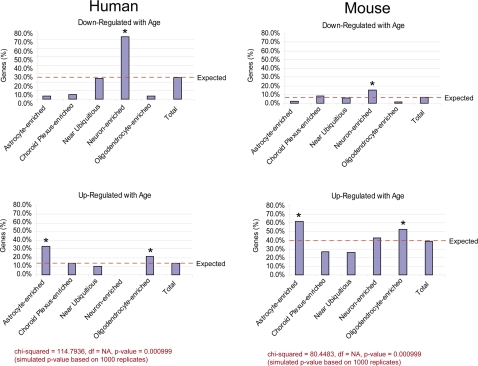
Figure 3. Cell type localization of gene expression in the aging cortex.
Genes enriched in specific cortical cell types, based on the Allen Brain Atlas, were analyzed in the aging mouse and human gene expression profiles. The percentage of age-regulated genes enriched in each cell type is represented by the Y-axis was determined as described in Methods. The expected percentages are indicated by the dashed line. Statistically significant cell type enrichment was determined using a Chi-square test with a permutation-based p-value (1,000 replicates). Specific cell types that exhibit a statistically significant change in age-regulated genes are indicated by an asterisk.

