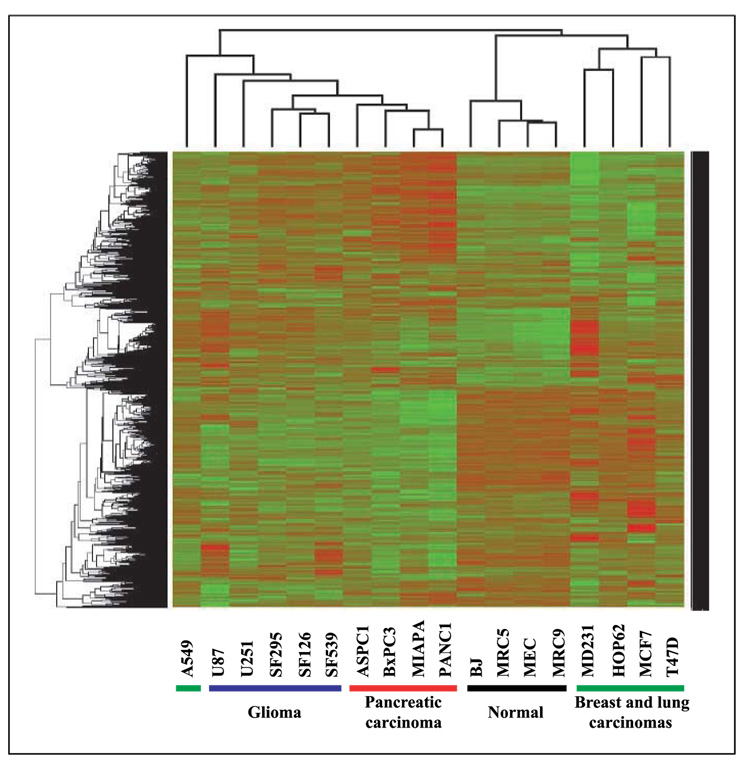
Figure 1.
Two-way heat map comparing the genes whose translational activities were affected by radiation in each cell line. Cell lines were irradiated (2 Gy) and polysome-bound RNA collected 6 h later. To identify genes whose translation was either up-regulated or down-regulated by radiation, biological replicates were averaged for each cell line and compared with the polysome-bound RNA profiles generated from their corresponding control (unirradiated) cells using SAM (<1% FDR). Those genes were then used to derive unsupervised cluster maps using average linkage distance measurement and Pearson’s correlation metric. Up-regulation (red) and down-regulation (green) in irradiated cells.

