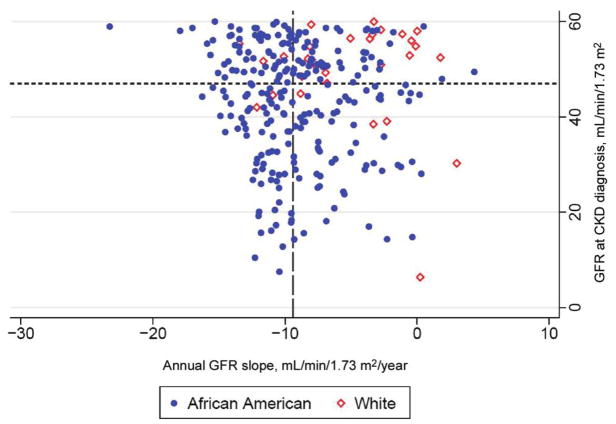
Figure 1.
Scatterplot showing distribution of HIV-infected subjects with chronic kidney disease, in terms of their glomerular filtration rate (GFR) at diagnosis and their subsequent annualized GFR slope. The figure is divided into quadrants based on the median GFR at baseline (47 mL/min/1.73 m2 [short-dashed horizontal line] ) and the median GFR slope (long-dashed vertical line, −9.4 mL/min/1.73 m2/year). White subjects are overrepresented in the upper-right quadrant (least-aggressive disease) and are underrepresented in the lower-left quadrant (most-aggressive disease).

