
Fig. 4.
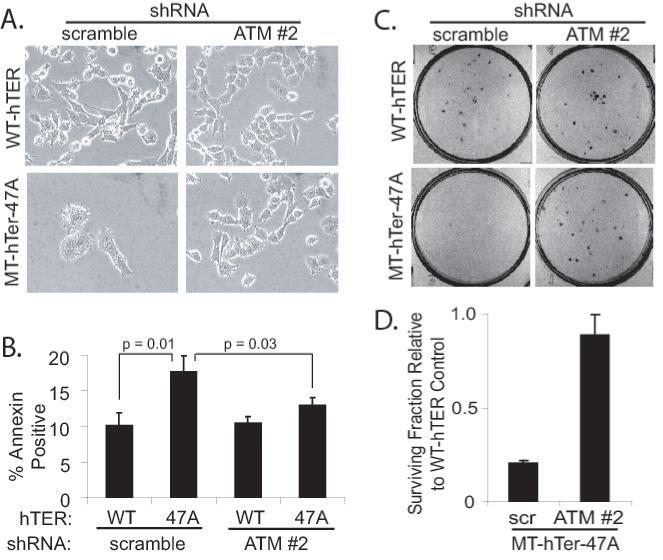
ATM depletion minimizes MT-hTer-47A effects in LOX cells. LOX melanoma cells were infected with scramble #1 or ATM #2 shRNAs at day -2, followed by WT-hTER or MT-hTer-47A at day 0. A. Phase-contrast microscope images were obtained at day 8. B. Day 6 cells were harvested and stained with annexin V-phycoerythrin and 7-amino-actinomycin D (7-AAD), and staining was analyzed by flow cytometry. The graph indicates the number of annexin positive cells (irrespective of 7-AAD status) in each sample. Error bars indicate the standard deviation for three separate hTER infections. C. Day 2 cells were harvested and replated in 6-well plates at a density of 100 cells per well. Cells were fixed and stained with crystal violet after 7 days of additional growth to assess colony number, and images of representative wells are shown. D. The graph shows the fraction of surviving colonies in MT-hTer-47A-treated wells relative to the corresponding WT-hTER-treated wells based on data from three independent experiments. Error bars indicate the standard deviation, and the difference between the samples is statistically significant (p < 0.001).