
Figure 4.
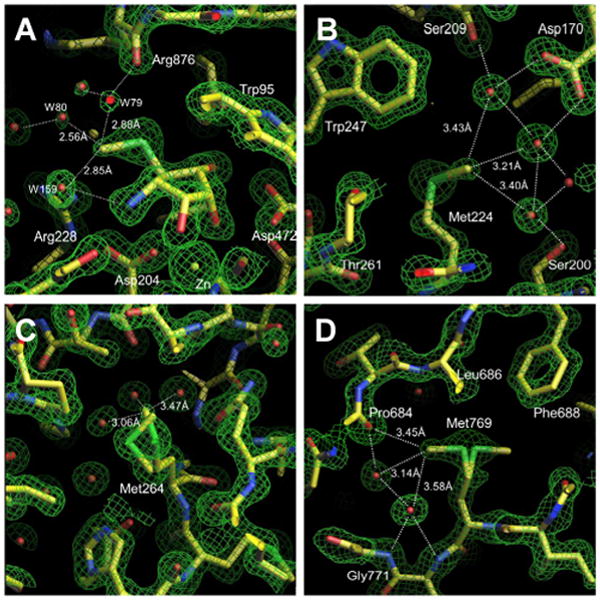
Comparison of the density of Mannostatin A cf1 with methionine residues of dGMII found in similar environments. Possible water interactions are shown with dotted lines. Distances between the thiomethyl group and proximal waters are indicated. The electron density (2Fo-Fc) is contoured at 1.5 -2 sigma. The figures are generated in O. A. Mannostatin A cf1 B. Methionine 224 C. Methionine264, showing both conformers D. Methionine769, showing both conformers.