Figure 1.

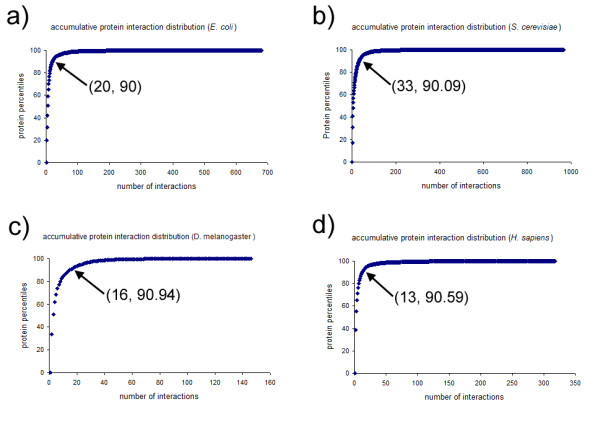
Accumulative protein interaction distribution plots. a) E. coli, b) S. cerevisiae, c) D. melanogaster, d) H. sapiens. On each plot, the (x, y) coordinate of the sharp turn or the inflection point is shown.

Accumulative protein interaction distribution plots. a) E. coli, b) S. cerevisiae, c) D. melanogaster, d) H. sapiens. On each plot, the (x, y) coordinate of the sharp turn or the inflection point is shown.