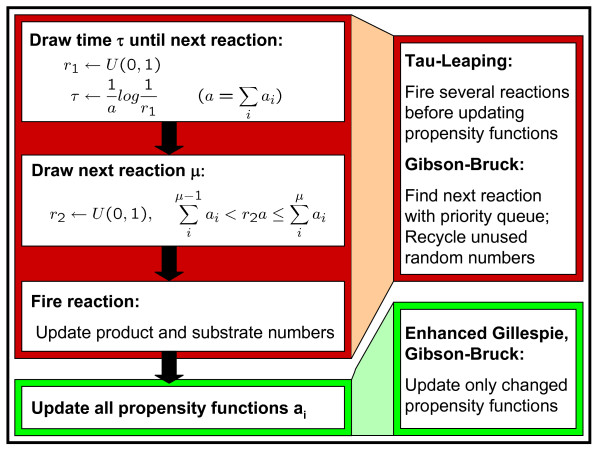
Figure 1.
Stochastic simulation. This figure shows the flow of one simulation step. On the left-hand side the flow for the original Gillespie algorithm can be seen. On the right-hand side, we illustrate how the different steps are modified by the Gibson-Bruck, enhanced Gillespie and tau-leaping algorithms. Here, U(0, 1) denotes the uniform distribution on the range of 0 to 1 and aμ the reaction propensity for reaction μ.

