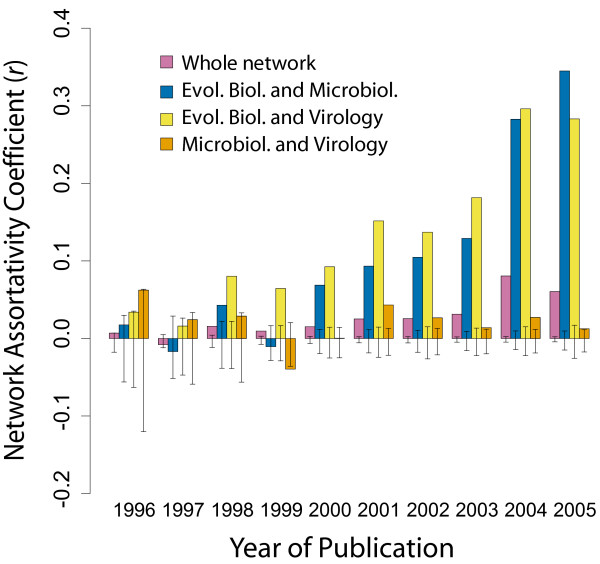
Figure 3.
Field-field network assortativity calculations data. Bar chart showing the changes in whole network and field-field network assortativity coefficient calculations (r). Error bars show 95% confidence interval of distribution of r values calculated from 1000 simulated networks (see Methods).

