Figure 2.


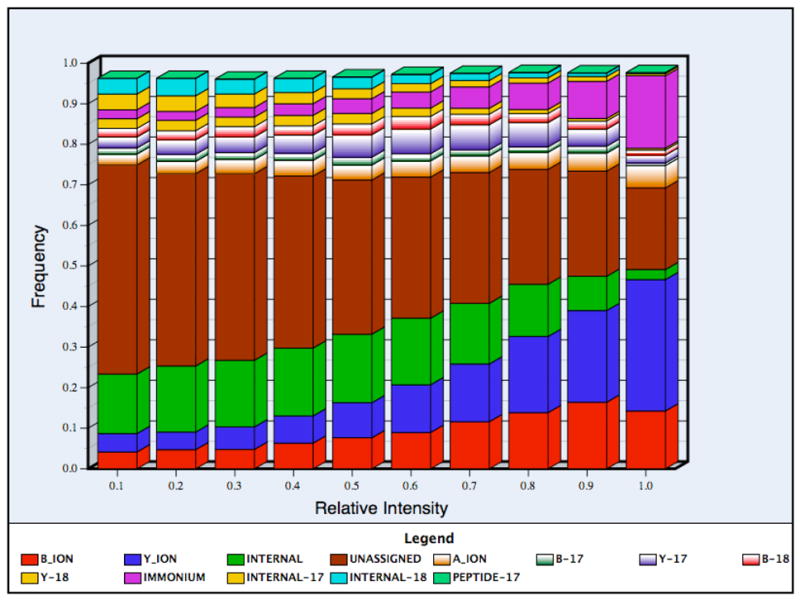
Figure 2(a). The frequency ratios of each type of product ion as a function of peak intensity. The intensity distribution was calculated as the relative frequency (listed as percentile ranges) of observing each ion type in a fraction of observed ions. The peaks were divided into ten bins according to their intensities and in each bin the relative frequency of the different ion types was calculated. The ions with very small probabilities (such as c, x, z ions) are not shown in the histogram. The 95% confidence intervals were very small (within 20% of the observed values) and were thus omitted for clarity.
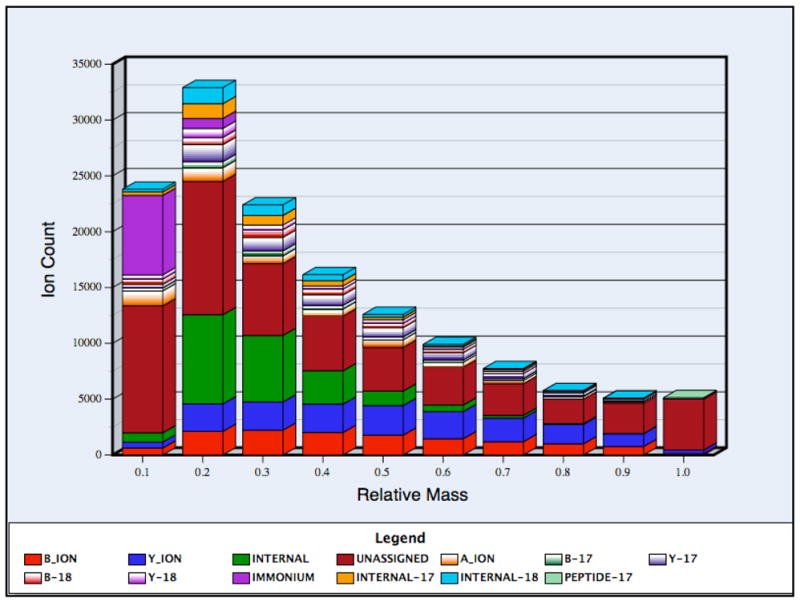
Figure 2(b). The frequency ratios of each type of product ion as a function of relative mass. The horizontal axis represents the masses of fragment ions as a proportion of precursor mass. The observed mass range for product ions was divided into ten different bins according to their masses with respect to precursor ion and the relative frequency of observing each ion type was calculated for each bin. The 95% confidence intervals were small (within 20% of the reported values) and were thus omitted for clarity.
