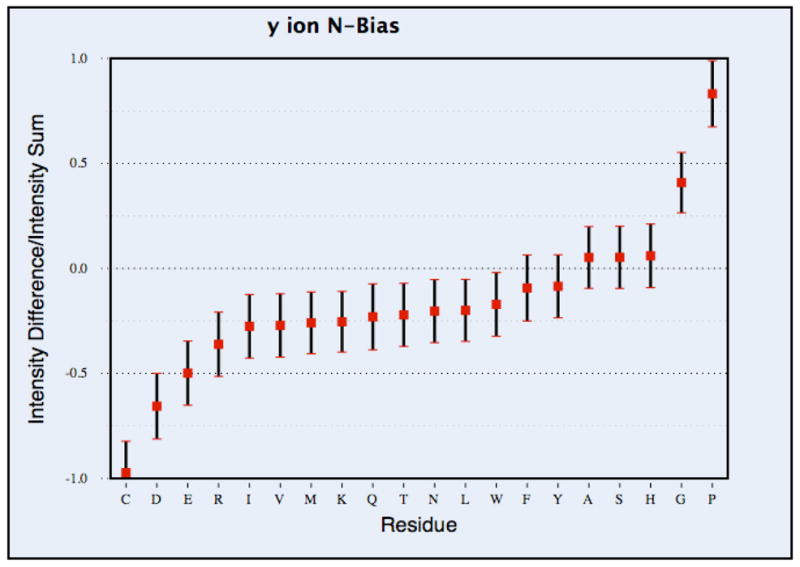
Figure 3.


Figure 3(a). Directionality of bond cleavage. The blue bars represent the cleavage frequency at the N-terminal side while the red bars represent the cleavage frequency at the C-terminal side of each residue. The frequency was calculated by dividing the total number of cleavage events for a specific amino acid by the total number of amino acid of that type present in the dataset. The 95% confidence intervals are shown with black bars, calculated by bootstrap resampling as described in the methods.
Figure 3(b). The N-bias for y ions, corresponding to each residue type. The N-bias was calculated by taking the ratio of the intensity difference of the C-terminal peaks and the N-terminal peaks to the intensity sum, for all observed y ions produced from breakages adjacent to the given residue. The mean value of the N-bias is marked by the small square and the 95% confidence interval is shown with black bars, calculated by bootstrap resampling.
