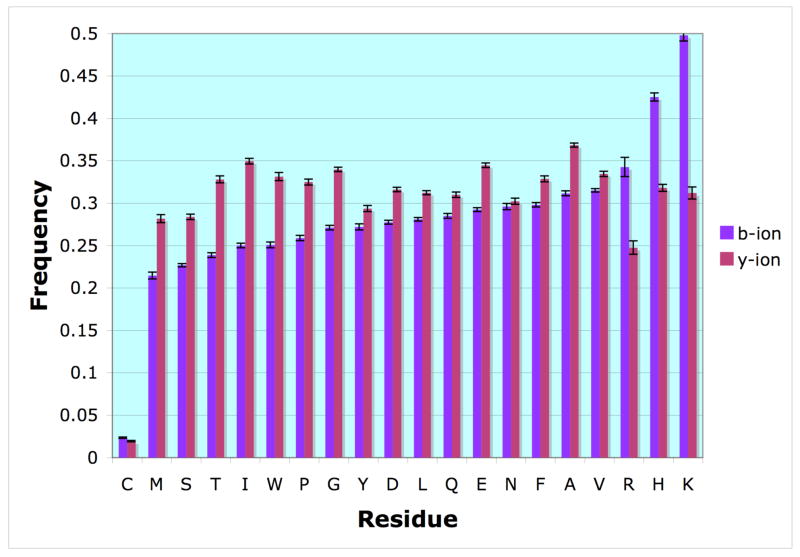
Figure 5.
The frequency of amino acid occurrences within b and y ions. The bars represent the frequency at which a specific amino acid was present in a b-type ion (blue) or y-type ion (red). This was calculated by dividing the number of times an amino acid was present within the given ion type by the total number of occurrences of that amino acid in the collection of peptides. The 95% confidence interval is shown, calculated by bootstrap resampling.

