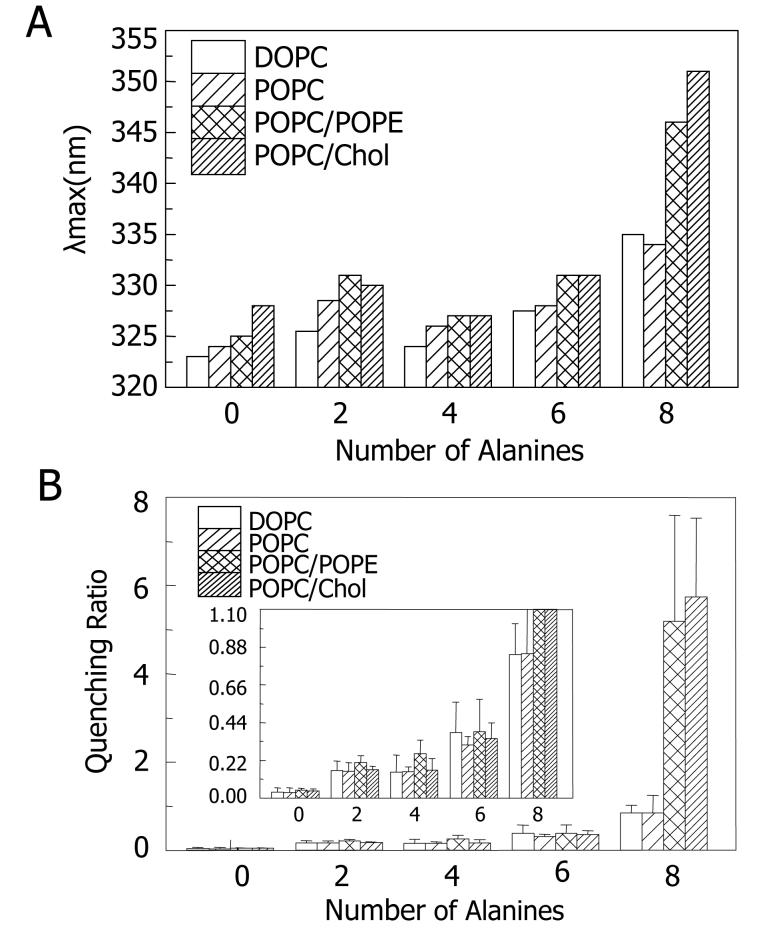
Figure 2.
Effect of lipid structure upon the stability of TM state measured by λmax and quenching ratio for peptides incorporated into lipid vesicles without net charge. (A) λmax. (B) Q-ratio. All samples were prepared at pH 4. POPC/POPE mol ratio is 1:1 and POPC/cholesterol mol ratio is 3:2. The λmax values and Q-ratio reported are average from at least three samples. Standard deviations for Q-ratios are shown and the λmax values in individual samples generally within ±1 nm of the average values. Inset: Version of (B) with expanded y-axis.

