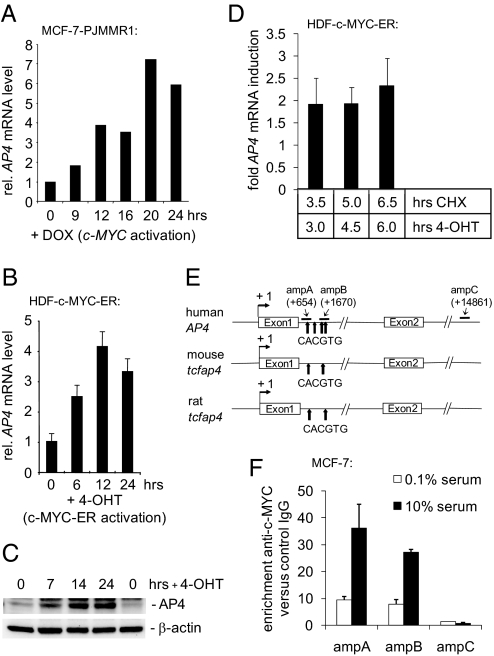
Fig. 1.
Characterization of AP4 as a direct c-MYC target gene. (A) Quantification of AP4 mRNA after activation of c-MYC. MCF-7-PJMMR1 cells were treated with ICI (1 μM) for 60 h before activation of c-MYC by addition of doxycycline (DOX, 1 μg/ml) for the indicated periods, and RNA was subjected to qPCR analysis. (B) Quantification of AP4 mRNA after c-MYC activation. HDF-MYC-ER cells were serum-deprived for 48 h. After addition of 4-OHT (200 nM), total RNA was isolated at the indicated time points from biological triplicates. AP4 mRNA expression was determined by qPCR analysis. Error bars indicate standard deviations. (C) AP4 protein expression after c-MYC activation. Protein lysates were prepared from HDF-MYC-ER cells at the indicated time points. Expression of AP4 and β-actin was determined by immunoblotting. (D) HDF-MYC-ER cells were grown to confluence and treated with 4-OHT (200 nM) and CHX (70 nM), as indicated. The expression level of AP4 after combined CHX/4-OHT treatment was normalized to cells treated with CHX alone. Expression of AP4 and, for normalization, β-actin mRNA was determined by qPCR. Analyses were performed in triplicates. Error bars indicate standard deviations. (E) Comparison of the mouse, rat, and human AP4 promoter regions. “+1” indicates the transcription start site. “amp” indicates PCR amplicons used for qChIP analysis with their positions relative to the transcription start site. Arrows indicate the approximate positions of canonical c-MYC-binding sites (CACGTG). The positions of these sites relative to the transcription start site (“+1”) are +660, +1262, +1645, and +1766 for human AP4; +560 and +1620 for the mouse tcfap4; and +666 and +1725 for the rat tcfap4, respectively. (F) Detection of c-MYC at the AP4 promoter. MCF-7 cells were serum-starved (0.1% serum) for 48 h or restimulated (10% serum) for 12 h. Chromatin was cross-linked and subjected to qChIP analysis with a c-MYC-specific antibody and, as a control, rabbit IgG. qPCR analysis was performed with primers flanking three of the four canonical E-boxes in the first AP4 intron (“ampA” and “ampB”; see also Fig. 1C) or a control primer pair (“ampC”) localized in the last intron of AP4. For normalization, a fragment not containing E-boxes from chromosome 16q22 was used.

