Figure 8.

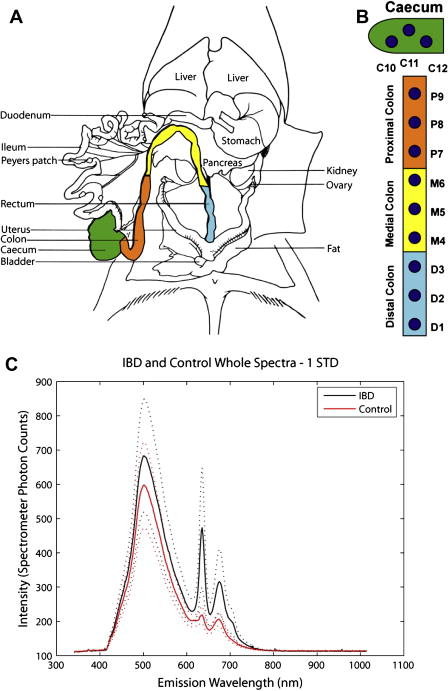
8A. Illustration of dissected mouse abdominal cavity, showing distal, medial, and proximal colon as well as caecum 8B. Sample sites along mouse colon 8C. Average IBD and control tissue spectra. Note that every 5th variable is plotted in this figure, and the dashed lines represent one standard deviation of acquired spectral data.
